import pandas as pd
import pathmc
from pathmc.paths import data_dir

df = pd.read_csv(data_dir / "mediation.csv")

spec = """
M ~ a*X
Y ~ b*M + c*X
indirect := a*b
"""

m = pathmc.model(spec, data=df)Welcome
Structural causal models, made simple.
Specify your causal assumptions as equations. Fit with full Bayesian inference. Simulate interventions and ask “what if?”
pathmc compiles a concise formula language into a generative Bayesian model where every variable is wired through its structural parents in the DAG. Call model() to build and inspect, then fit() to run MCMC. One object handles introspection, estimation, causal queries, identification checking, and sensitivity analysis, all with full posterior uncertainty. Estimation itself has two paths: fit the full structural model, or fit a regression-adjustment model for one total effect.
Once the model is built, fit it and use its posterior and causal-query methods:
# Path 1 — full structural model
m.fit()
m.effects_summary()  # labeled coefficients + defined params
m.ate("Y", "X", values=(0, 1))  # average treatment effect via do-operator
m.adjustment_sets("X", "Y")  # check identification from the DAG
m.comparisons("Y", "X")  # interpret-layer contrast (diff, or ratio/lift)

# Path 2 — regression adjustment for the total effect of X on Y
adj = m.adjustment_model("X -> Y")
adj.fit()
adj.ate(values=(0, 1))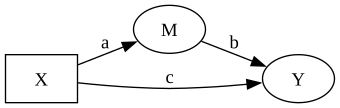
\begin{aligned} \beta_{M} &\sim \text{Normal}(mu=0,\, sigma=10) \\ \sigma_{M} &\sim \text{HalfNormal}(sigma=1) \\ \beta_{Y} &\sim \text{Normal}(mu=0,\, sigma=10) \\ \sigma_{Y} &\sim \text{HalfNormal}(sigma=1) \\[6pt] \mu_{M} &= \beta_{0,\,M} + a \cdot \mathrm{X} \\ \mathrm{M} &\sim \text{Normal}(\mu_{M},\, \sigma_{M}) \\ \mu_{Y} &= \beta_{0,\,Y} + b \cdot \mathrm{M} + c \cdot \mathrm{X} \\ \mathrm{Y} &\sim \text{Normal}(\mu_{Y},\, \sigma_{Y}) \\ indirect &\equiv a \cdot b \end{aligned}
Explore the DAG before you have data
You don’t need a DataFrame to start thinking causally. Pass just a spec string to model() and immediately explore the DAG structure, check identification, and review priors — all before collecting or cleaning data.
m = pathmc.model("""
    M ~ a*X
    Y ~ b*M + c*X
    indirect := a*b
""")

m.graph()  # render the causal DAG
m.equations()  # structural equations + priors
m.adjustment_sets("X", "Y")  # valid backdoor adjustment sets
m.is_identifiable("X", "Y")  # identification check
When data arrives, create a data-bound model and fit:
m = pathmc.model(spec, data=df)
m.fit()
One spec, five capabilities
A single spec string unlocks the full causal analysis toolkit.
Introspection — inspect the model before spending any time on MCMC. Render the causal DAG, display structural equations with LaTeX, review default priors, and refine priors iteratively. graph(), equations(), and set_priors() work with or without data; sample_prior_predictive() requires a data-bound model to set sample size and exogenous inputs.
m.graph()  # causal DAG plot
m.equations()  # structural equations + priors
m.set_priors({"beta_Y": Prior(...)})  # refine priors
m.sample_prior_predictive()  # check priors generate plausible data (requires data)
Estimation — two ways to learn from the same spec. Fit the full structural causal model when you need every equation, path-specific effects, or a do() query that propagates through mediators. Fit a regression adjustment when the question is the total effect of one treatment on one outcome: the DAG is used only to choose the adjustment set, then pathmc fits that one reduced outcome equation.
# Path 1 — full structural model
m.fit()
m.effects_summary()  # labeled coefficients + defined params
m.standardized()  # stdyx-standardized effects
m.effect("X -> M -> Y")  # indirect effect through M

# Path 2 — regression adjustment for a total effect
adj = m.adjustment_model("X -> Y")
adj.formula  # e.g. "Y ~ X + Z"
adj.fit()
adj.ate(values=(0, 1))
adj.comparisons(comparison="diff")
Both paths share ate(), comparisons(), and slopes(). The structural path can also answer indirect effects and interventions on mediators; the adjustment path cannot, because those mediators were never given their own equation. See Estimation Approaches and SCM vs Regression Adjustment.
Causal queries — simulate interventions via the do-operator and ask counterfactual questions. pathmc uses g-computation: it forward-simulates through the structural model under the intervention, propagating full posterior uncertainty through the causal chain. The shared interpret layer (predictions(), comparisons(), slopes()) generalizes two-point ate() to grids, ratio/lift contrasts, and local derivatives.
m.ate("Y", "X", values=(0, 1))  # average treatment effect
m.cate("Y", "X", condition={"Z": 2})  # conditional ATE given Z=2
m.prob("Y > 0", set={"X": 1})  # P(Y > 0) under intervention
m.comparisons("Y", "X", comparison="lift")  # percent change on the response scale
m.slopes("Y", "X")  # local derivative under intervention
Identification — before trusting a causal estimate, verify it is identifiable. pathmc finds valid adjustment sets, checks for collider bias, and tests the DAG’s conditional independence claims against your data. Structural checks work without data; test_implications() requires data.
m.adjustment_sets("X", "Y")  # valid backdoor adjustment sets
m.collider_warnings({"C"}, "X", "Y")
m.test_implications()  # check DAG against data
Sensitivity analysis — causal conclusions rest on untestable assumptions about unmeasured confounding. pathmc quantifies how strong an unmeasured confounder would need to be to overturn your finding.
m.sensitivity("Y", "X") # tipping point analysisApplied use cases
pathmc isn’t just for textbook examples. The examples gallery covers real problems across industries.
Estimate channel-level ROI with adstock and saturation transforms that capture carry-over effects and diminishing returns. Panel mode handles geo-level data with hierarchical random effects. Full example →
spec = """
sales ~ b_tv*logistic_saturation(adstock(tv, decay=theta_tv), lam=lam_tv)
      + b_dig*logistic_saturation(adstock(digital, decay=theta_dig), lam=lam_dig)
      + trend
"""
adstock(x, decay=param) models carry-over effects; logistic_saturation(x, lam=param) captures diminishing returns. Both transform parameters are estimated from data alongside the regression coefficients.
Assess whether a biomarker is a valid surrogate for clinical outcomes using mediation analysis and the do-operator. Quantify what fraction of the treatment effect flows through the measured pathway. Full example →
spec = """
antibody     ~ a*vaccine + age
hospitalized ~ b*antibody + c*vaccine + age + comorbidity
"""
Labeled coefficients (a*, b*, c*) let you decompose the total effect into indirect (a*b, through antibodies) and direct (c, bypassing antibodies) pathways.
Model a multi-stage funnel as a causal chain to find which stage has the highest leverage on paid conversion. Simulate “what if we improve onboarding?” scenarios that respect the full causal structure. Full example →
spec = """
engagement ~ e_ch*channel_quality + e_on*onboarding_score
activated  ~ a_eng*engagement + a_ch*channel_quality
converted  ~ c_act*activated + c_eng*engagement
"""
Each equation models one stage. Multiple equations form the causal chain — effects propagate through the system, so improving onboarding lifts engagement, which lifts activation, which lifts conversion.
Price and demand are confounded. This notebook checks a hierarchical panel model against a planted elasticity; the sample does not recover it. Full example →
spec = """
demand ~ 0 + b_price*price + b_lag*lag(price)
       + b_comp*competitor_price + b_season*season + trend
"""
lag(price) creates the previous period’s value automatically in panel mode. Random slopes on price (specified at model() time) let each region have its own elasticity, partially pooled toward a population mean. Partial pooling already drops the fixed intercept; 0 + keeps equations() from printing a phantom 1 + that is not in the design matrix.
Built-in guardrails
pathmc doesn’t just compute causal effects — it helps you check whether you should trust them.
- Identification checks verify that your causal effect is estimable from observational data before you spend time sampling.
- Collider warnings flag adjustment sets that would create spurious associations rather than remove them.
- Implied independence tests check the conditional independence claims encoded in your DAG against the data — violations suggest missing edges or structural misspecification.
- Sensitivity analysis quantifies how robust your conclusions are to unmeasured confounding, reporting tipping points and contour plots.
The goal is responsible causal inference: make it easy to ask hard questions about your own assumptions.
Getting started
- Overview — how pathmc works, from spec to causal insight
- Bayesian workflow — the iterative cycle of inspect, check, refine, fit, and query
- Model specification — DSL syntax:
~,~~,:=, labels, transforms - Causal inference — the do-operator, g-computation, identification
- Estimation approaches — structural do() vs native adjustment_model()
- Predictions, comparisons, and slopes — shared interpret API
- Examples — worked notebooks across mediation, MMM, panel data, interpret queries, and more
TipComing from lavaan?
pathmc speaks the same language — ~ for regression, ~~ for residual covariance, := for defined parameters, labeled coefficients like a*X. The difference: pathmc adds full Bayesian inference and a built-in do-operator for interventional simulation.