import numpy as np
import pandas as pd
import matplotlib.pyplot as plt
from scipy.special import expit
import pathmc

FIG_WIDTH = 7
FIG_HEIGHT = 4
COLOR_STRUCTURAL = "#2171b5"
COLOR_ADJUSTMENT = "#e6550d"
COLOR_TRUE = "#333333"
COLOR_ASSOC = "#969696"
SEGMENT_COLORS = {0.0: "#2171b5", 1.0: "#e6550d", 2.0: "#31a354"}


def plot_hdi_line(x, samples, ax, color, hdi_prob=0.94, alpha=0.2, label=None):
    """Posterior mean with quantile band. samples shape (n_draws, n_points)."""
    lo_q = (1 - hdi_prob) / 2
    lower = np.quantile(samples, lo_q, axis=0)
    upper = np.quantile(samples, 1 - lo_q, axis=0)
    mean = samples.mean(axis=0)
    ax.fill_between(x, lower, upper, color=color, alpha=alpha, linewidth=0)
    ax.plot(x, mean, color=color, linewidth=2.5, label=label)
    return mean


TRUE_B0 = -0.3
TRUE_B_DOSE = 0.9
TRUE_B_INC = 0.5
TRUE_B_INT = 0.4
TRUE_B_SEG = 0.25

rng = np.random.default_rng(42)
n = 600Conditional Predictions
Response-scale predictions on a covariate grid with posterior HDI bands, associational vs interventional queries, and structural vs adjustment estimators.
How does predicted conversion probability change with ad spend when customer income and segment differ? predictions() evaluates the response mean (expected conversion probability for this Bernoulli model) on a datagrid() of covariate values. This notebook plots those curves with 94% HDI bands, overlays the planted truth from simulation, and contrasts associational fits with interventional set={...} queries on both a structural model and an AdjustmentModel.
Prerequisites: Predictions, Comparisons, and Slopes for the draw contract, and Treatment Effects with Non-Linear Models for why the log-odds coefficient is not the probability-scale effect.
Setup
The causal question
Goal: plot expected conversion probability as a function of ad spend, holding income and customer segment fixed, under do(ad_spend=...).
We simulate a Bernoulli outcome with an interaction so the probability curve bends with income. The structural model includes every mechanism; the adjustment model targets the total effect of ad_spend on converted via a backdoor set.
income = rng.normal(0, 1, n)
ad_spend = 0.6 * income + rng.normal(0, 0.5, n)
segment = np.where(income < -0.5, 0.0, np.where(income < 0.5, 1.0, 2.0))


def true_prob(ad_spend_vals, income_vals, segment_vals):
    logit = (
        TRUE_B0
        + TRUE_B_DOSE * ad_spend_vals
        + TRUE_B_INC * income_vals
        + TRUE_B_INT * ad_spend_vals * income_vals
        + TRUE_B_SEG * segment_vals
    )
    return expit(logit)


logit = (
    TRUE_B0
    + TRUE_B_DOSE * ad_spend
    + TRUE_B_INC * income
    + TRUE_B_INT * ad_spend * income
    + TRUE_B_SEG * segment
)
converted = rng.binomial(1, expit(logit)).astype(float)

df = pd.DataFrame({
    "income": income,
    "ad_spend": ad_spend,
    "segment": segment,
    "converted": converted,
})

spec = """
ad_spend ~ income
converted ~ ad_spend + income + ad_spend:income + segment
"""
scm = pathmc.model(spec, data=df, families={"converted": "bernoulli"})
scm.fit(random_seed=42)

adj = scm.adjustment_model("ad_spend -> converted")
adj.fit(random_seed=42)
Initializing NUTS using jitter+adapt_diag...
Multiprocess sampling (4 chains in 4 jobs)
NUTS: [beta_converted, sigma_ad_spend, beta_ad_spend]Sampling 4 chains for 1_000 tune and 1_000 draw iterations (4_000 + 4_000 draws total) took 4 seconds.
Initializing NUTS using jitter+adapt_diag...
Multiprocess sampling (4 chains in 4 jobs)
NUTS: [beta_converted]Sampling 4 chains for 1_000 tune and 1_000 draw iterations (4_000 + 4_000 draws total) took 3 seconds.<xarray.DataTree>
Group: /
├── Group: /posterior
│ Dimensions: (chain: 4, draw: 1000, converted_predictors: 3,
│ mu_converted_dim_0: 600)
│ Coordinates:
│ * chain (chain) int64 32B 0 1 2 3
│ * draw (draw) int64 8kB 0 1 2 3 4 5 ... 995 996 997 998 999
│ * converted_predictors (converted_predictors) <U9 108B 'Intercept' ... 'in...
│ * mu_converted_dim_0 (mu_converted_dim_0) int64 5kB 0 1 2 3 ... 597 598 599
│ Data variables:
│ beta_converted (chain, draw, converted_predictors) float64 96kB -0...
│ mu_converted (chain, draw, mu_converted_dim_0) float64 19MB 0.33...
│ Attributes:
│ created_at: 2026-09-30T20:17:25.776238+00:00
│ creation_library: ArviZ
│ creation_library_version: 1.2.0
│ creation_library_language: Python
│ inference_library: pymc
│ inference_library_version: 6.2.0
│ sample_dims: ['chain', 'draw']
│ sampling_time: 2.801068067550659
│ tuning_steps: 1000
├── Group: /sample_stats
│ Dimensions: (chain: 4, draw: 1000)
│ Coordinates:
│ * chain (chain) int64 32B 0 1 2 3
│ * draw (draw) int64 8kB 0 1 2 3 4 5 ... 995 996 997 998 999
│ Data variables: (12/18)
│ lp (chain, draw) float64 32kB -364.8 -365.5 ... -361.7
│ n_steps (chain, draw) float64 32kB 7.0 3.0 3.0 ... 3.0 3.0
│ smallest_eigval (chain, draw) float64 32kB nan nan nan ... nan nan
│ index_in_trajectory (chain, draw) int64 32kB 6 -2 -1 -2 -5 ... 1 2 -2 -3
│ step_size_bar (chain, draw) float64 32kB 0.8628 0.8628 ... 0.818
│ acceptance_rate (chain, draw) float64 32kB 0.8726 0.9294 ... 0.8151
│ ... ...
│ diverging (chain, draw) bool 4kB False False ... False False
│ tree_depth (chain, draw) int64 32kB 3 2 2 2 3 2 ... 1 2 2 3 2 2
│ reached_max_treedepth (chain, draw) bool 4kB False False ... False False
│ largest_eigval (chain, draw) float64 32kB nan nan nan ... nan nan
│ process_time_diff (chain, draw) float64 32kB 0.000348 ... 0.000161
│ perf_counter_diff (chain, draw) float64 32kB 0.0003481 ... 0.0001617
│ Attributes:
│ created_at: 2026-09-30T20:17:25.783138+00:00
│ creation_library: ArviZ
│ creation_library_version: 1.2.0
│ creation_library_language: Python
│ inference_library: pymc
│ inference_library_version: 6.2.0
│ sample_dims: ['chain', 'draw']
│ sampling_time: 2.801068067550659
│ tuning_steps: 1000
├── Group: /observed_data
│ Dimensions: (converted_dim_0: 600)
│ Coordinates:
│ * converted_dim_0 (converted_dim_0) int64 5kB 0 1 2 3 4 ... 596 597 598 599
│ Data variables:
│ converted (converted_dim_0) int64 5kB 1 0 1 1 1 0 1 ... 0 0 0 0 1 1 0
│ Attributes:
│ created_at: 2026-09-30T20:17:25.785538+00:00
│ creation_library: ArviZ
│ creation_library_version: 1.2.0
│ creation_library_language: Python
│ inference_library: pymc
│ inference_library_version: 6.2.0
│ sample_dims: []
├── Group: /constant_data
│ Dimensions: (income_dim_0: 600, ad_spend_dim_0: 600)
│ Coordinates:
│ * income_dim_0 (income_dim_0) int64 5kB 0 1 2 3 4 5 ... 595 596 597 598 599
│ * ad_spend_dim_0 (ad_spend_dim_0) int64 5kB 0 1 2 3 4 ... 595 596 597 598 599
│ Data variables:
│ income (income_dim_0) float64 5kB 0.3047 -1.04 ... 0.2417 -1.775
│ ad_spend (ad_spend_dim_0) float64 5kB 0.4405 -0.9128 ... -1.594
│ Attributes:
│ created_at: 2026-09-30T20:17:25.786180+00:00
│ creation_library: ArviZ
│ creation_library_version: 1.2.0
│ creation_library_language: Python
│ inference_library: pymc
│ inference_library_version: 6.2.0
│ sample_dims: []
└── Group: /log_likelihood
Dimensions: (chain: 4, draw: 1000, converted_dim_0: 600)
Coordinates:
* chain (chain) int64 32B 0 1 2 3
* draw (draw) int64 8kB 0 1 2 3 4 5 6 ... 994 995 996 997 998 999
* converted_dim_0 (converted_dim_0) int64 5kB 0 1 2 3 4 ... 596 597 598 599
Data variables:
converted (chain, draw, converted_dim_0) float64 19MB -0.5382 ... ...
Attributes:
created_at: 2026-09-30T20:17:25.921614+00:00
creation_library: ArviZ
creation_library_version: 1.2.0
creation_library_language: Python
inference_library: pymc
inference_library_version: 6.2.0
sample_dims: ['chain', 'draw']Interventional predictions on a grid
Build a grid with datagrid(), then pass it to predictions() with per-row set values for ad spend. Each grid row is one unit; posterior draws carry the unit dimension.
dose_grid = np.linspace(-2.0, 2.0, 30)
income_levels = [-1.0, 0.0, 1.0]
grid = pathmc.datagrid(df, ad_spend=dose_grid, income=income_levels, segment=[1.0])

pred_do = scm.predictions(
    "converted",
    set={"ad_spend": grid["ad_spend"].values},
    newdata=grid,
)
print(f"interventional={pred_do.interventional}, causal={pred_do.causal}")
interventional=True, causal=TrueThe posterior mean and 94% HDI at each grid point sit on the probability scale because the interpret layer applies the inverse link.
Code
fig, ax = plt.subplots(figsize=(FIG_WIDTH, FIG_HEIGHT * 1.1))
da = pred_do.dataset["converted"]

for inc in income_levels:
    mask = np.isclose(grid["income"].values, inc)
    x = grid.loc[mask, "ad_spend"].values
    samples = da.isel(unit=np.where(mask)[0]).stack(sample=("chain", "draw")).values.T
    sort_idx = np.argsort(x)
    x_sorted = x[sort_idx]
    samples_sorted = samples[:, sort_idx]
    plot_hdi_line(
        x_sorted,
        samples_sorted,
        ax,
        color=COLOR_STRUCTURAL,
        alpha=0.15,
        label=f"income={inc:g}",
    )
    true_y = true_prob(x_sorted, inc, 1.0)
    ax.plot(x_sorted, true_y, color=COLOR_TRUE, linestyle="--", linewidth=1.5)

ax.set_xlabel("ad_spend (standardized)")
ax.set_ylabel("P(converted)")
ax.set_ylim(0, 1)
ax.legend(title="Posterior mean", frameon=False)
plt.tight_layout()
plt.show()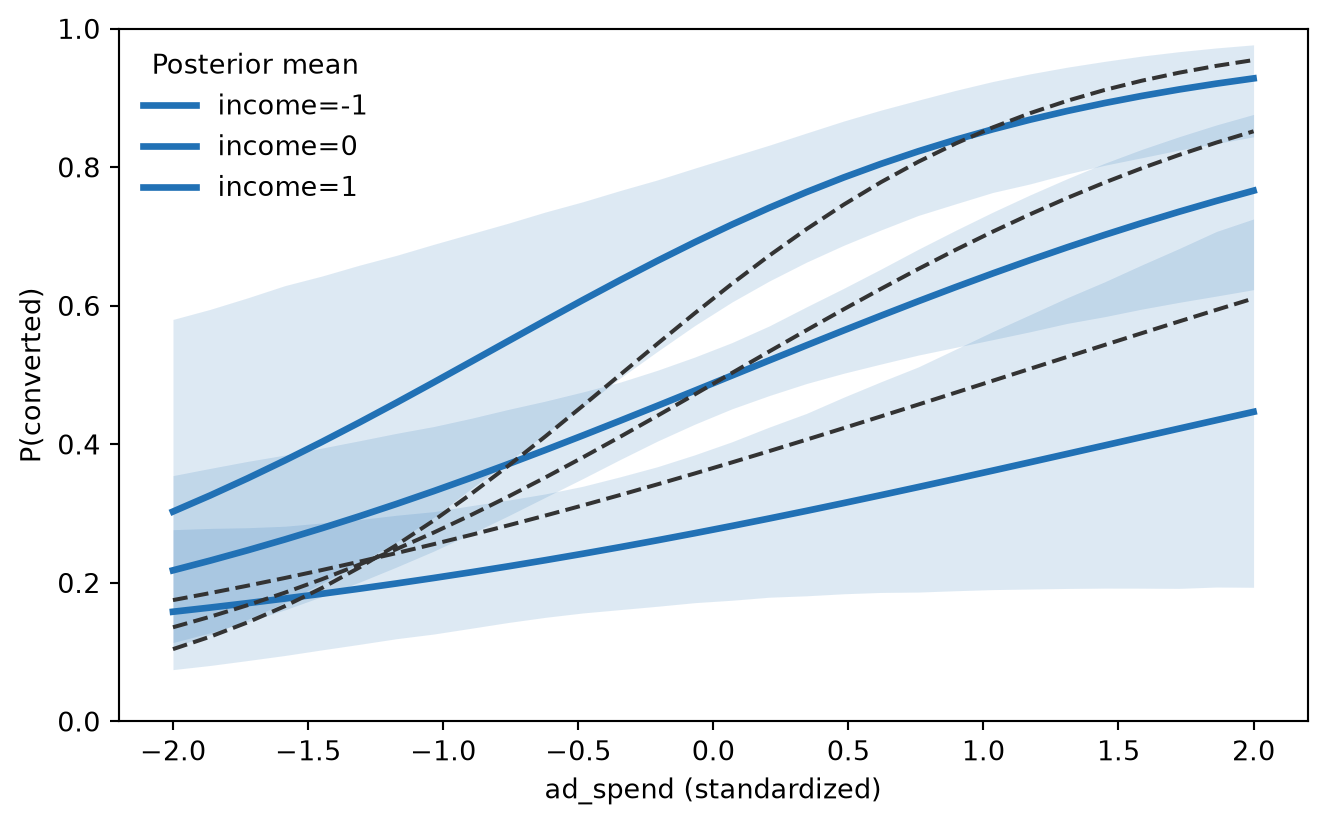
NoteResponse mean vs posterior predictive
predictions() returns kind="mean" draws: expected conversion probability with residual noise off. Posterior predictive bands (sampling 0/1 outcomes) require do(kind="predictive") or sample_posterior_predictive(); this notebook stays on the mean surface that comparisons() and ate() share.
Associational vs interventional
Without set, predictions() evaluates the fitted structural equations at observed covariates. With set, graph surgery fixes ad spend while income follows each row’s profile.
pred_assoc = scm.predictions("converted", newdata=grid.iloc[:3])
pred_int = scm.predictions(
    "converted",
    set={"ad_spend": grid["ad_spend"].iloc[:3].values},
    newdata=grid.iloc[:3],
)
print("associational:", pred_assoc.causal, pred_assoc.interventional)
print("interventional:", pred_int.causal, pred_int.interventional)
associational: False False
interventional: True TrueStructural vs adjustment on the same grid
Both estimators expose predictions() with the same signature. When identification holds and both equations are correctly specified, the interventional curves should overlap.
Code
grid_one = pathmc.datagrid(df, ad_spend=dose_grid, income=[0.0], segment=[1.0])
pred_scm = scm.predictions(
    "converted",
    set={"ad_spend": grid_one["ad_spend"].values},
    newdata=grid_one,
)
pred_adj = adj.predictions(
    set={"ad_spend": grid_one["ad_spend"].values},
    newdata=grid_one,
)

fig, ax = plt.subplots(figsize=(FIG_WIDTH, FIG_HEIGHT))
x = grid_one["ad_spend"].values

for result, color, label in [
    (pred_scm, COLOR_STRUCTURAL, "structural"),
    (pred_adj, COLOR_ADJUSTMENT, "adjustment"),
]:
    samples = result.dataset["converted"].stack(sample=("chain", "draw")).values.T
    plot_hdi_line(x, samples, ax, color=color, alpha=0.2, label=label)

ax.plot(
    x,
    true_prob(x, 0.0, 1.0),
    color=COLOR_TRUE,
    linestyle="--",
    linewidth=1.5,
    label="true",
)
ax.set_xlabel("ad_spend")
ax.set_ylabel("P(converted)")
ax.set_ylim(0, 1)
ax.legend(frameon=False)
plt.tight_layout()
plt.show()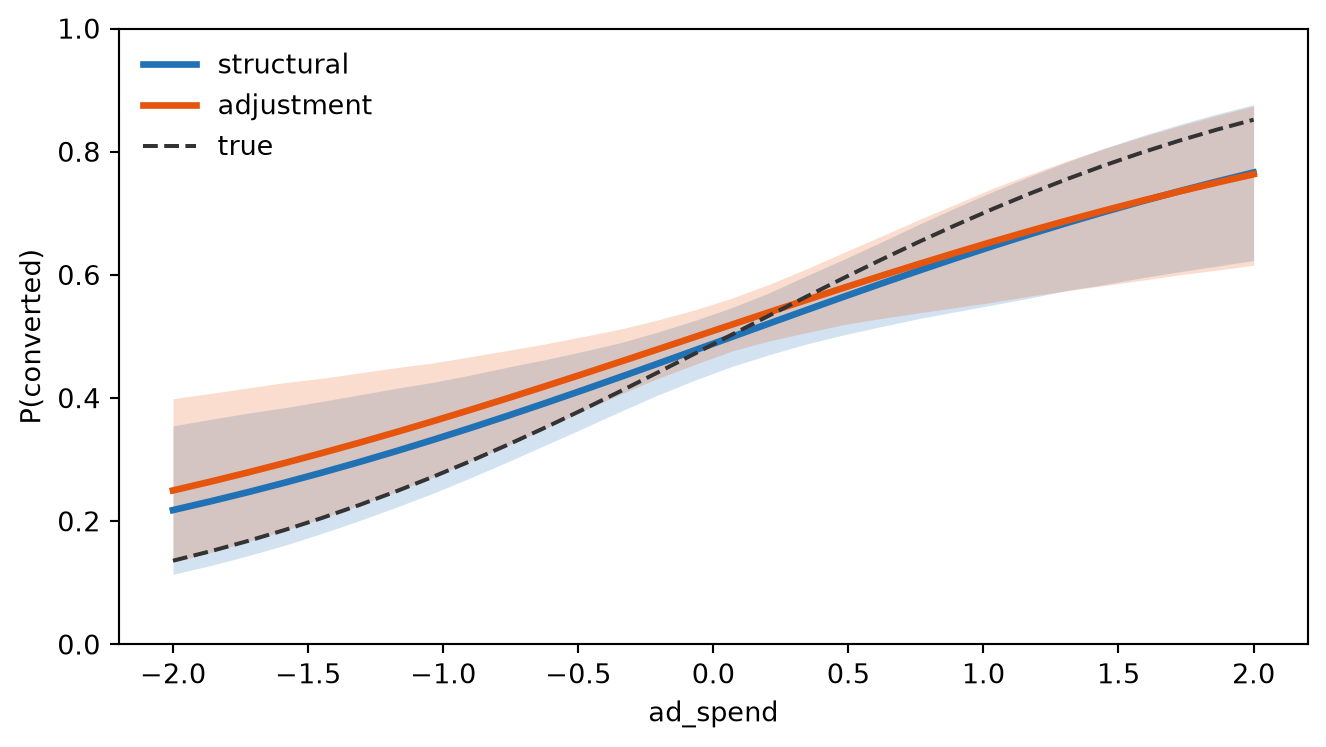
Customer segment as a categorical covariate
Segment enters the model as a numeric code (0=low, 1=mid, 2=high income tier). On the grid we hold ad spend and income fixed and vary segment; a line plot would be misleading, so we use points with error bars.
Code
seg_grid = pathmc.datagrid(df, ad_spend=[1.0], income=[0.0], segment=[0.0, 1.0, 2.0])
pred_seg = scm.predictions(
    "converted",
    set={"ad_spend": seg_grid["ad_spend"].values},
    newdata=seg_grid,
)
da = pred_seg.dataset["converted"]
means = da.mean(dim=("chain", "draw")).values
stacked = da.stack(sample=("chain", "draw"))
lo = stacked.quantile(0.03, dim="sample").values
hi = stacked.quantile(0.97, dim="sample").values
segments = seg_grid["segment"].values
true_vals = true_prob(1.0, 0.0, segments)

fig, ax = plt.subplots(figsize=(FIG_WIDTH, FIG_HEIGHT))
for i, seg in enumerate(segments):
    color = SEGMENT_COLORS[seg]
    ax.errorbar(
        seg,
        means[i],
        yerr=[[means[i] - lo[i]], [hi[i] - means[i]]],
        fmt="o",
        color=color,
        markersize=8,
        capsize=4,
        linewidth=2,
    )
    ax.plot(
        seg, true_vals[i], marker="D", color=COLOR_TRUE, linestyle="none", markersize=7
    )

ax.set_xticks([0, 1, 2])
ax.set_xticklabels(["low", "mid", "high"])
ax.set_xlabel("segment")
ax.set_ylabel("P(converted)")
ax.set_ylim(0, 1)
plt.tight_layout()
plt.show()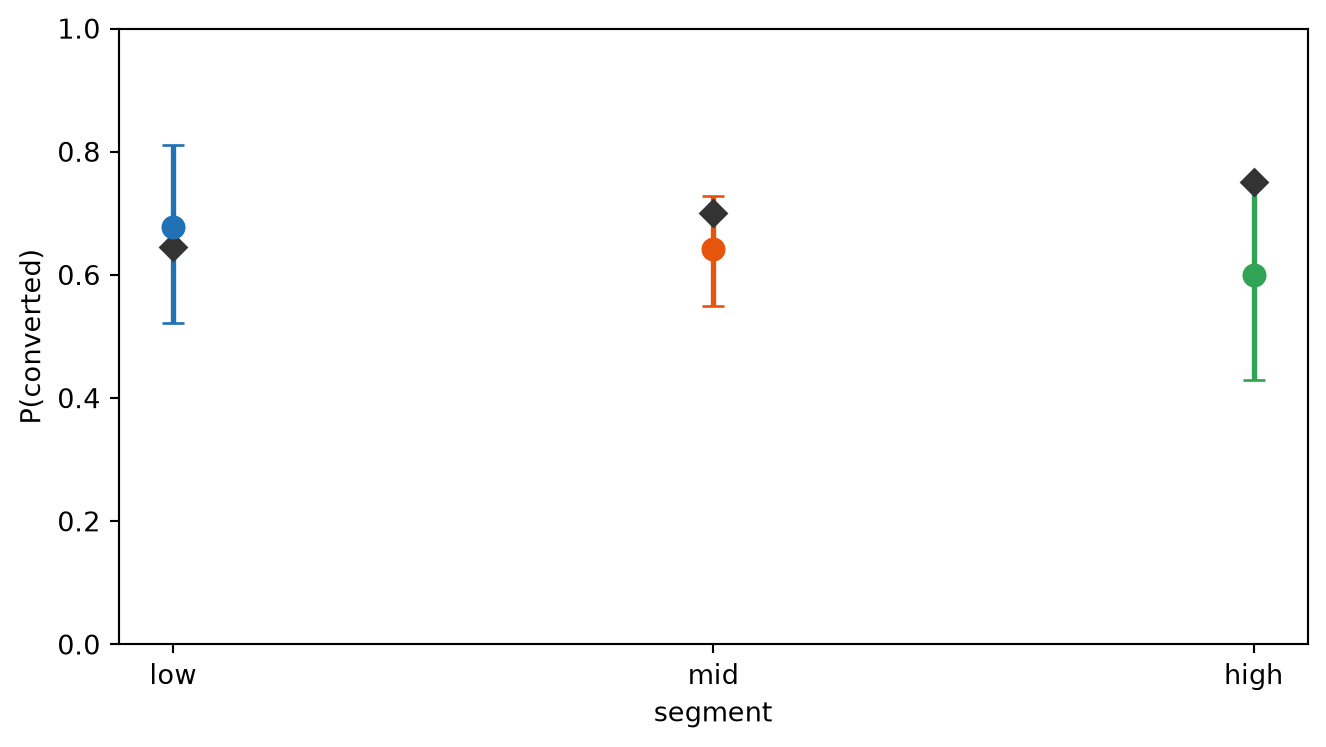
Predictions table
summary_rows = []
for i in range(len(grid_one)):
    row = grid_one.iloc[i]
    sub = pred_scm.dataset["converted"].isel(unit=i)
    mean = float(sub.mean())
    stacked = sub.stack(sample=("chain", "draw"))
    lo = float(stacked.quantile(0.03))
    hi = float(stacked.quantile(0.97))
    summary_rows.append({
        "ad_spend": row["ad_spend"],
        "income": row["income"],
        "segment": row["segment"],
        "mean": mean,
        "hdi_low": lo,
        "hdi_high": hi,
    })

pd.DataFrame(summary_rows).head(8)| ad_spend | income | segment | mean | hdi_low | hdi_high | |
|---|---|---|---|---|---|---|
| 0 | -2.000000 | 0.0 | 1.0 | 0.218081 | 0.113837 | 0.354866 |
| 1 | -1.862069 | 0.0 | 1.0 | 0.232160 | 0.127926 | 0.365269 |
| 2 | -1.724138 | 0.0 | 1.0 | 0.247000 | 0.143773 | 0.375374 |
| 3 | -1.586207 | 0.0 | 1.0 | 0.262606 | 0.160996 | 0.384457 |
| 4 | -1.448276 | 0.0 | 1.0 | 0.278974 | 0.180295 | 0.394634 |
| 5 | -1.310345 | 0.0 | 1.0 | 0.296096 | 0.200876 | 0.405140 |
| 6 | -1.172414 | 0.0 | 1.0 | 0.313951 | 0.222880 | 0.415911 |
| 7 | -1.034483 | 0.0 | 1.0 | 0.332509 | 0.245883 | 0.425727 |
Summary
- datagrid() builds the covariate product; each row is one
unitin InterpretResult. - Interventional curves use
set={...}; associational baselines omit it (causal=False). - On a Bernoulli outcome the response scale is probability, not log-odds.
- Structural and adjustment estimators share the API; overlay them when teaching the two paths.
Next steps: Interventional Contrasts for diff / ratio / lift; Local Slopes when the effect of ad spend depends on income; Predictions, Comparisons, and Slopes for the contract; Causal Inference for ate().
NoteReflection
In your domain, which covariates belong on a prediction grid (segment, region, product tier) and which are true intervention levers? Would stakeholders read associational fitted curves or only interventional set={...} curves?